# This Python 3 environment comes with many helpful analytics libraries installed
# It is defined by the kaggle/python Docker image: https://github.com/kaggle/docker-python
# For example, here's several helpful packages to load

import numpy as np # linear algebra
import pandas as pd # data processing, CSV file I/O (e.g. pd.read_csv)

# Input data files are available in the read-only "../input/" directory
# For example, running this (by clicking run or pressing Shift+Enter) will list all files under the input directory

import os
for dirname, _, filenames in os.walk('/kaggle/input'):
    for filename in filenames:
        print(os.path.join(dirname, filename))

# You can write up to 20GB to the current directory (/kaggle/working/) that gets preserved as output when you create a version using "Save & Run All"
# You can also write temporary files to /kaggle/temp/, but they won't be saved outside of the current session
import pandas as pd
import requests
from io import StringIO
url = "https://uniheart.pa-ca.me/proxy?url=https%3A%2F%2Fraw.githubusercontent.com%2Fhuangjia2019%2Fhouse%2Fmaster%2Fhouse.csv"
headers = {
'User-Agent': 'Mozilla/5.0 (Windows NT 10.0; Win64; x64) AppleWebKit/537.36 (KHTML, like Gecko) Chrome/91.0.4472.124 Safari/537.36'
}
response = requests.get(url, headers=headers)
response.raise_for_status()
df_housing = pd.read_csv(StringIO(response.content.decode('utf-8')))
df_housing.head()Loading...
# 构建特征集 X
X = df_housing.drop("median_house_value", axis=1)
# 构建标签集 y
y = df_housing.median_house_value
# 导入 sklearn 工具库
from sklearn.model_selection import train_test_split
# 以 80%/20% 的比例进行数据集的拆分
X_train, X_test, y_train, y_test = train_test_split(X, y, test_size=0.2, random_state=0)
# 导入线性回归算法模型
from sklearn.linear_model import LinearRegression
# 确定线性回归算法
model = LinearRegression()
# 根据训练集数据,训练机器,拟合函数
model.fit(X_train, y_train)Loading...
# 预测验证集的 y 值
y_pred = model.predict(X_test)
print('房价的真值(测试集)', y_test)
print('预测的房价(测试集)', y_pred)
房价的真值(测试集) 3873 171400.0
3625 189600.0
3028 500001.0
13814 229400.0
15398 163400.0
...
1363 212500.0
7947 210500.0
14574 142900.0
10009 128300.0
9149 84700.0
Name: median_house_value, Length: 3400, dtype: float64
预测的房价(测试集) [211157.06335416 218581.64298575 465317.31295563 ... 201751.23969632
160873.51846957 138847.26913351]
# 评估预测结果
print("给预测评分:", model.score(X_test, y_test))
给预测评分: 0.6321014171579498
import matplotlib.pyplot as plt
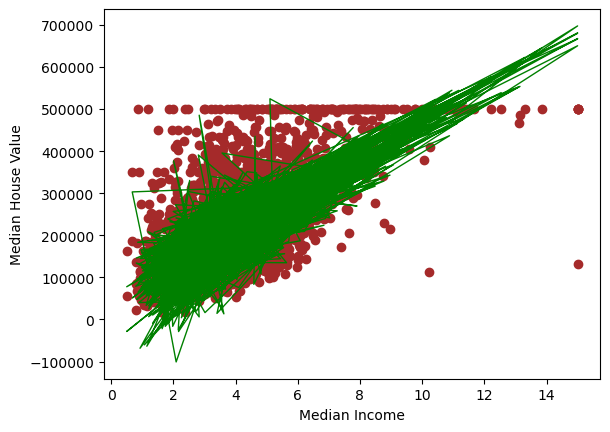
# 用散点图显示家庭收入中位数和房价中位数的分布
plt.scatter(X_test.median_income, y_test, color='brown')
# 画出回归函数(从特征到预测标签)
plt.plot(X_test.median_income, y_pred, color='green', linewidth=1)
# x轴:家庭收入中位数
plt.xlabel('Median Income')
# y轴:房价中位数
plt.ylabel('Median House Value')
plt.show()